It has been about two and a half years since I started as the managing director at WISE. In that time, WISE has started new initiatives, gotten a grasp of the data we have available to us, and successfully engaged U-M students in the new normal of higher education that has evolved since COVID interrupted the old normal. I’ve been here long enough to notice patterns in the questions that get asked of WISE, and I want to dedicate this space to answering those questions. This is just WISE’s first blog post – expect to read more about our work and the issues we wrestle with as we try to support STEM equity on campus (and beyond).
“Do we still need WISE?” or “Have things gotten any better?”
Although this isn’t the most common question that I get asked, it is perhaps the most fundamental question: “Why do you exist?” Sometimes this question gets asked by individuals who look around and see lots of women (or individuals who present as women) in their classes and labs. Other times it gets asked by a student or an alumna who feels all alone in their field or lab, and then the question often has an air of hopelessness around it. Sometimes we get asked a related question that could be paraphrased as, “Shouldn’t we all be focusing on racial equity in STEM (science, technology, engineering, and mathematics) now?,” implying that gender equity isn’t (or shouldn’t be) a major concern while at the same time erasing the unique experiences of BIPOC and Asian women.
To answer any or all of these questions, it’s helpful to have a shared language. For those who have been thinking about STEM equity for any period of time, this may feel remedial, but I think it’s essential that I am up front about how I’m defining the terms that many of us take for granted in everyday conversation. In October 2023, University of Michigan launched its new strategic plan around diversity, equity and inclusion, colloquially called “DEI 2.0.” In developing that strategic plan, the Office of Diversity, Equity and Inclusion (ODEI) has defined those terms. I find those definitions to be really helpful for laying a foundation of shared understanding, and I have also found this quote from a recent New York Times opinion piece by Harvard researchers (Caroline Elkins, Frances Frei, and Anne Morriss) helps operationalize the terms diversity and inclusion.
If the demographics of your team don’t bear much resemblance to the demographics of the broader population, then you’ve likely put artificial barriers on your talent pools and undermined your ability to reap the rewards of inclusion.
– Critics of D.E.I Forget That It Works (New York Times, January 21, 2024)
In addition to the terms that make up DEI, I am going to use the less nuanced language of biological sex, i.e. female and male, below as the data source I’m using (the Integrated Postsecondary Education Data System (IPEDS)) only has two categories for sex/gender. When discussing race and ethnicity, I am breaking our student population into four categories: “BIPOC,” “Asian,” “White,” and “International or Unknown.” The term BIPOC here includes individuals who self identify as Black, Hispanic or Latina/o, Indigenous, Native Alaskan, Pacific Islander, or 2 or more races and are US citizens or permanent residents (i.e. Green Card holders). Asian here includes US citizens or permanent residents of Asian descent. White includes US citizens or permanent residents who identify as white and not Hispanic or Latina/o. The fourth category, “International or Unknown” includes individuals who did not indicate a race or ethnicity category and individuals who are temporary visa holders. Additionally, it is useful to note that we are defining STEM here more narrowly than it is often defined; we are excluding most social and behavioral sciences. For this discussion, STEM includes
- Natural Resources & Conservation
- Engineering
- Biological and Biomedical Sciences
- Military Technologies and Applied Sciences
- Physical Sciences
- Computer & Information Sciences and Support Services
- Engineering-Related Technologies/Technicians
- Mathematics and Statistics
- Fitness and Kinesiology
- Science Technologies/Technicians
So, how does the pool of STEM graduates receiving Bachelor’s degrees from University of Michigan compare to the demographics of our broader population? Per Dr. Elkins, Dr. Frei and Ms. Morriss, are there artificial barriers that keep some students from succeeding in STEM at U-M? A relatively simple way to answer these questions is to look at which students are awarded STEM degrees and compare the racial and gender distributions of that group to the overall enrollment profile of students at U-M. For simplicity’s sake, let’s focus on undergraduate degrees awarded to US citizens or permanent residents for now. Over the last 5 years (which includes academic years 17-18, 18-19, 19-20, 20-21, and 21-22), U-M has awarded 33,433 undergraduate degrees to US citizens or permanent residents, and 15,112 of those degrees were in a STEM discipline. Of those 15,112 STEM degrees, 40% went to women. Table 1 gives a more detailed breakdown of the STEM undergraduate degrees awarded over the last five academic years for which I have data.
| Sex | Race | Number of STEM Degrees Awarded | Percent of STEM Degrees Awarded |
|---|---|---|---|
| Both | All | 15112 | 100% |
| Female | All | 6037 | 39.9% |
| Female | BIPOC | 853 | 5.6% |
| Female | Asian | 1235 | 8.2% |
| Female | White | 3949 | 26.1% |
| Male | All | 9075 | 60.1% |
| Male | BIPOC | 1244 | 8.2% |
| Male | Asian | 2104 | 13.9% |
| Male | White | 5727 | 37.9% |
Table 1. The demographics of the population of students receiving undergraduate STEM degrees from University of Michigan in the last five years.
To provide a comparison to a broader population, Table 2 and Figure 1 provide the 5-year average demographic breakdown of the enrolled U-M undergraduate student body compared to the breakdown of the demographics of individuals receiving STEM degrees and compared to the breakdown of individuals receiving any undergraduate degree.
| Sex | Race/Ethnicity | STEM Degrees | Undergrad Student Body | All Undergraduate Degrees |
|---|---|---|---|---|
| Female | BIPOC | 5.6% | 9.5% | 8.5% |
| Female | Asian | 8.2% | 8.6% | 8.0% |
| Female | White | 26.1% | 33.1% | 34.4% |
| Male | BIPOC | 8.2% | 8.2% | 7.2% |
| Male | Asian | 13.9% | 9.1% | 9.1% |
| Male | White | 37.9% | 31.6% | 32.9% |
Table 2. Comparing the demographics of the populations of students earning undergraduate STEM degrees over the last five years to the average undergraduate student population and the population of undergraduates earning any degree.
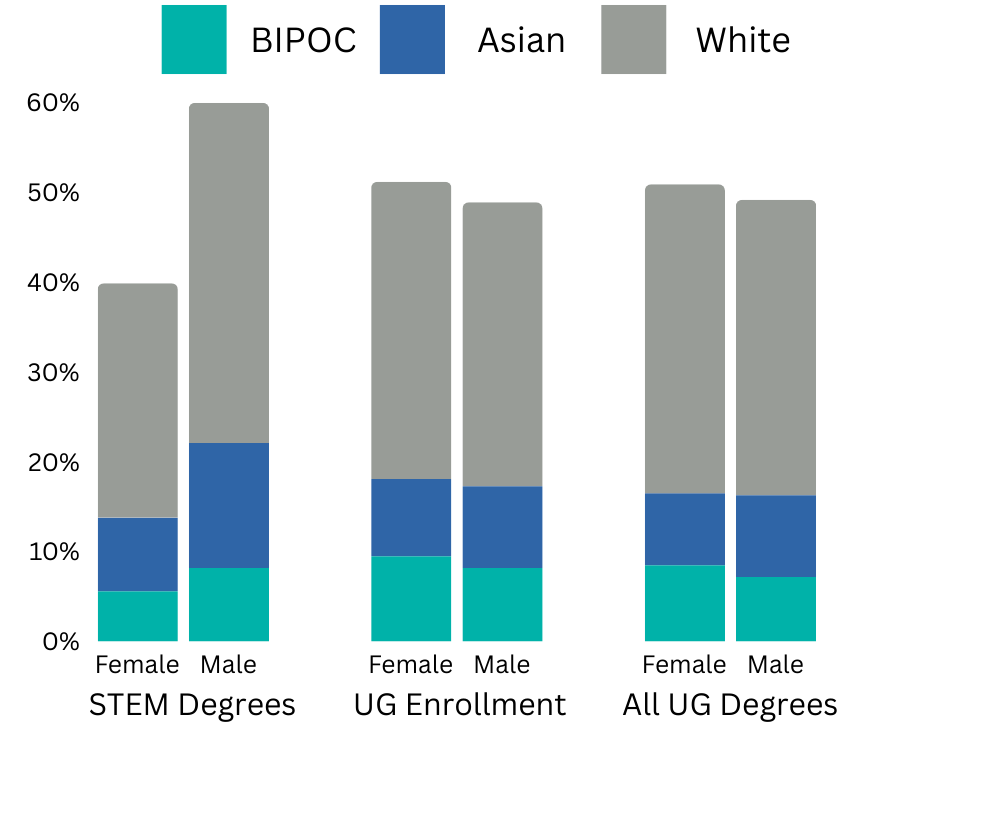
Getting straight to the point: The group of undergraduates leaving U-M with STEM degrees doesn’t resemble the broader undergraduate student body here.
When we look at the relative proportions of females being awarded STEM degrees, all races & ethnicities are underrepresented relative to the respective proportions of males being awarded STEM degrees from U-M AND relative to the population of female undergraduate students at U-M. When we compare the demographics of the students earning STEM undergraduate degrees to the larger group of U-M students earning undergraduate degrees during the same time, BIPOC and white female students are relatively underrepresented amongst STEM degree recipients. The proportion of Asian women in the STEM degree recipients is slightly higher than in the larger population of undergraduate degree recipients. (Note: I haven’t yet done the analysis to determine statistical significance).
These numbers tell us that our pool of undergraduate STEM degree recipients is less diverse, with respect to gender and race, than our population of undergraduate students. Looking a little deeper into these numbers (which I’ll explore in future posts) we find, though, that some STEM disciplines are actually dominated by female-identifying students (life sciences, I’m looking at you) and that the percentage of STEM degrees going to women has increased over time in many of the male-dominated STEM disciplines.
These numbers, though, don’t necessarily tell us much about equity or inclusion for female-identifying students in STEM. Looking at ODEI’s definitions, I conclude:
- If STEM departments are equitable for female-identifying students, those students have equal opportunity for success relative to their male-identifying counterparts and any experiences of bias, harassment, or discrimination are actively challenged and responded to.
- If STEM departments are inclusive for women, female-students’ perspectives are welcomed and respectfully heard and every woman feels a sense of belonging, not just at U-M, but in STEM.
The authors of the opinion piece linked above (Elkins, Frei, and Morriss) would assert that there are systemic reasons, or artificial barriers, in STEM that limit the talented pool of women undergraduates at U-M, i.e. that there isn’t equal opportunity. What is striking to me, as I think about equity and inclusion, is that although we at WISE believe strongly that equity and inclusion (and the related concept of justice) for women in STEM are our ultimate objectives, most of our work is focused on supporting the female-identifying students, not on changing the environments those students are learning in.
The problem with our approach is that we aren’t physically present in the places where female identifying students might face discrimination or harassment. We aren’t sitting next to women while they are doing group projects to make sure their perspectives are heard by their peers.
What we (primarily, but not exclusively) do, and have been doing, is help female-identifying students develop additional supports (beyond those they came to U-M with) to help them survive inequitable and exclusionary learning experiences. We try to help them find a sense of belonging in STEM at U-M even when it is easier to feel like you belong in the fields where you aren’t in the minority. We coach students in how to speak up for themselves and for their peers who are also marginalized.
I know all of that work is important – I needed that kind of support as I pursued my undergraduate, graduate and postdoctoral studies in chemistry. But I also believe that there are real limitations to the impact WISE can have if our focus is primarily on working with female-identifying students.
There’s no indication that U-M cannot reach a point where our STEM graduating classes reflect our broader student demographics, but we have to collectively decide that it’s important to remove any “artificial barriers put on our talent pools.” We have to make sure we aren’t telling our female-identifying students to “just speak louder in groups” while metaphorically giving their peers better noise-canceling headphones. We have to make sure all faculty and staff in STEM departments feel confident and skilled at challenging bias, harassment, and discrimination. We have to understand what those “artificial barriers” look like so we can remove them.
Do we still need WISE? Yes, but maybe WISE needs to be doing something different in addition to what we’ve been doing. Have things gotten any better? Yes, they have, but there’s evidence that even in female-dominated STEM fields, women still face discrimination and feel excluded. Shouldn’t we all be focusing on racial equity in STEM now? Yes, and that includes looking at the intersections of race gender and the unique STEM experiences of BIPOC and Asian women.
Over the course of this series, I’ll dive deeper into how WISE thinks about these existential questions, how things have changed over time, and how University of Michigan compares to our peers and national demographics. And, I will share my thoughts on how WISE can continue to create change on campus, but also how YOU, regardless of how you’re connected to University of Michigan, can play a part in furthering the efforts to foster STEM equity and inclusion on campus.
Lastly, as you peruse the data presented above, taken from the Integrated Postsecondary Education Data System (IPEDS) via the data explorer provided by the National Center for Science and Engineering Statistics, know that WISE cares about the experiences of international students (which were excluded from my analyses) and that we fully acknowledge that the experiences of male STEM students on campus are complicated and nuanced. As I use this blog series to dive deeper into the data we are exploring, and perhaps more importantly into the actions that could be taken based on these data, we will also interrogate other dimensions of equity work in STEM.